In the world of corporate finance, maintaining transparency is critical, but sometimes, numbers may be manipulated to present a more favourable picture. Earnings management is one of the ways in which companies attempt to “smooth” their financial statements, potentially misleading investors. Identifying such manipulations is vital, especially for data analysts in the finance sector, who often rely on sophisticated analytical tools to detect inconsistencies. The ability to spot earnings management is akin to a detective unravelling a mystery, sifting through evidence, and pinpointing the hidden truths behind seemingly benign numbers.
What is Earnings Management?
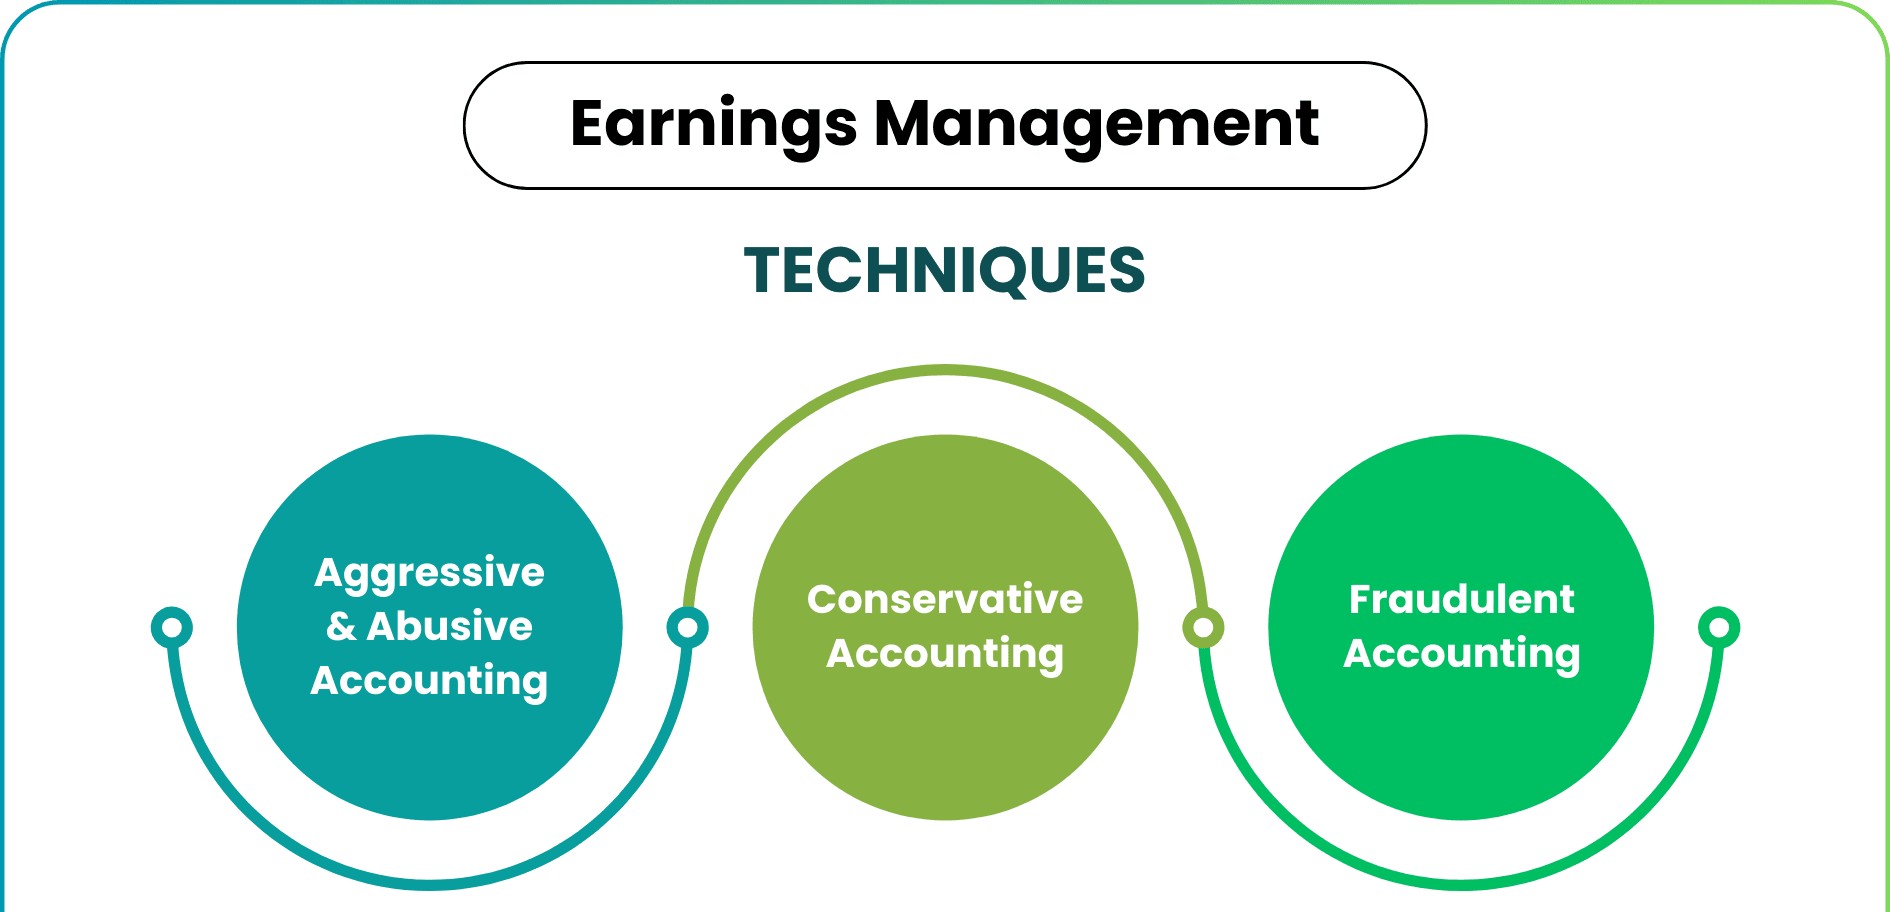
Earnings management refers to the strategic manipulation of financial reports, typically with the aim of influencing the perception of a company’s financial health. This practice can be either legal or illegal, but the fine line between the two is often blurred. Legal earnings management might include shifting revenues or expenses from one period to another, while illegal practices could involve fraudulent reporting or misrepresentation of facts.
For a data analyst, identifying earnings management can be an intricate task, as it requires going beyond basic accounting to uncover subtleties in financial statements. A data analyst course can provide the foundational knowledge needed to approach such complex problems. Analysts can leverage various statistical tools and models to detect irregularities in financial data and flag potential manipulations. One such technique is the Beneish M-Score, a powerful tool that helps detect earnings manipulation.
Analytical Techniques for Detecting Earnings Management
1. Beneish M-Score
The Beneish M-Score is a widely used formula that employs eight financial ratios to detect possible earnings manipulation. By analysing factors such as the days’ sales in receivables and the ratio of total assets to sales, the model calculates a score that indicates the likelihood of earnings manipulation. A higher M-Score suggests that the company is at a higher risk of manipulating its financial reports.
For those interested in the data analytics course in Mumbai, understanding the Beneish M-Score can be an essential tool in fraud detection. The M-Score doesn’t just rely on basic accounting principles; it incorporates advanced statistical models to flag anomalies that may not be immediately visible.
2. Benford’s Law
Benford’s Law, or the First-Digit Law, is another way to detect fraud. It says that in many real datasets, the first digit of numbers follows a certain pattern. For example, the number 1 should be the first digit about 30% of the time, while higher numbers like 9 appear less often.
A data analyst course teaches students how to use Benford’s Law on large datasets to find differences that could show accounting manipulation. Using this law on financial data helps analysts spot problems that might not be obvious at first.
3. Ratio Analysis
Ratio analysis involves calculating financial ratios to assess the health and performance of a company. Analysts look at profitability ratios, liquidity ratios, and leverage ratios to determine the financial stability of an organisation. Manipulations often cause these ratios to deviate significantly from historical trends or industry benchmarks.
For instance, if a company’s return on assets (ROA) suddenly spikes without a corresponding increase in sales or profitability, this could raise red flags. By understanding how to evaluate these ratios, students in a data analytics course in Mumbai can build a strong foundation for financial fraud detection.
Identifying Red Flags: When to Be Concerned
Detecting earnings management requires a keen eye for anomalies in financial data. Several indicators, or red flags, should trigger further investigation:
- Unexplained Changes in Financial Ratios: Significant shifts in key financial ratios, without a clear reason, should be a cause for concern. For example, if a company suddenly reports higher-than-usual earnings, it’s essential to examine the factors driving this change.
- Frequent Changes in Accounting Methods: Companies that frequently change their accounting methods, like revenue recognition policies, could be attempting to influence their reported earnings. A thorough analysis of their financial statements can help uncover such manipulations.
- Inconsistent Cash Flow: If a company reports strong profits but has poor cash flow, it may indicate that earnings have been artificially inflated.
For a data analyst course, mastering the art of detecting these red flags is an essential skill, as it allows analysts to provide valuable insights into the financial health of organisations.
Conclusion
Earnings management detection is an essential skill for any data analyst working in the financial sector. By leveraging tools like the Beneish M-Score, Benford’s Law, and ratio analysis, analysts can identify potential accounting manipulations and ensure that companies maintain financial transparency. These techniques go beyond basic number crunching; they require a deep understanding of financial statements, statistical models, and business operations. Through courses like the data analytics course in Mumbai, professionals can acquire the skills needed to tackle this complex task, ensuring that they remain vigilant in the face of potential financial deception.
Business Name: ExcelR- Data Science, Data Analytics, Business Analyst Course Training Mumbai
Address: Unit no. 302, 03rd Floor, Ashok Premises, Old Nagardas Rd, Nicolas Wadi Rd, Mogra Village, Gundavali Gaothan, Andheri E, Mumbai, Maharashtra 400069, Phone: 09108238354, Email: enquiry@excelr.com.